48%
Setup Time Reduction
Drag-and-drop structural conditional path builder significantly lowered time required to construct new research campaigns.
Case Study / Survey Pacific Case Study
A comprehensive UX audit and platform redesign of India’s leading field data collection and audience intelligence framework.

Survey Pacific handles critical field data points for multi-national brands, NGOs, and municipal governments. However, their outdated web interface led to high drop-off rates during complex questionnaire setup, while their mobile survey tool was difficult for operators to run in low-connectivity rural zones.
UX Pacific was commissioned to run a ground-up redesign. Our mandate was simple yet critical: turn a slow, technical grid interface into a frictionless, accessible, and fast data collection pipeline.
We combined direct contextual user testing with deep strategic benchmarking to rebuild the questionnaire flow. Here are the core services we activated:
UX Pacific was commissioned to run a comprehensive heuristic evaluation and revamp the end-to-end interface. Our target was to streamline high-volume operations, optimize user flows for professional researchers, and build a unified design system that their engineering team could scale globally.
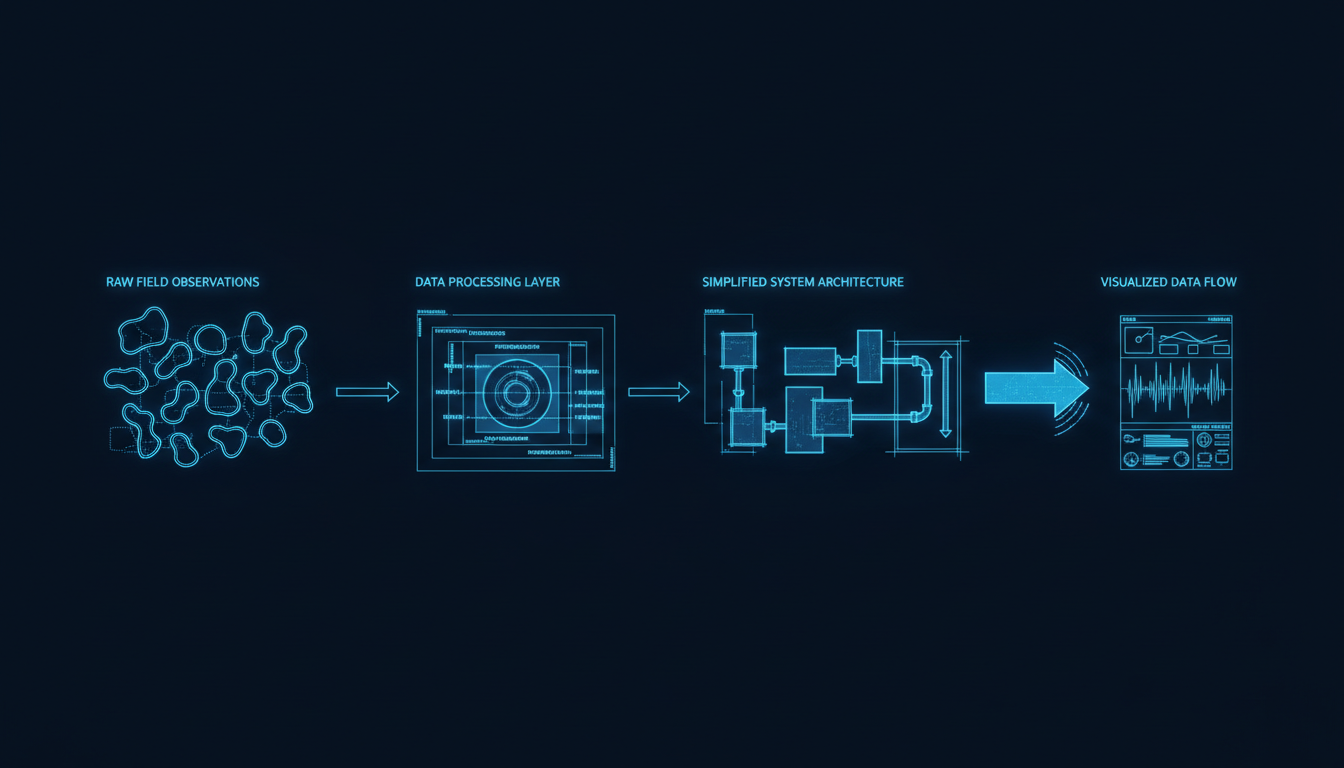

Survey analysts spend hours daily inputting parameters, structuring queries, and monitoring data pipelines. The original system suffered from extreme cognitive overload: data density was too high, hierarchy was absent, and critical feedback alerts were often missed.
The objective was clear: transform a chaotic tool into a clean, high-performance workstation. We needed to protect user focus, speed up standard tasks by 30%, and make data visualization instantly actionable.
Success wasn’t just measured in clean layouts, but in actual performance. Post-launch user testing and analytics proved significant improvements.
48%
Setup Time Reduction
Drag-and-drop structural conditional path builder significantly lowered time required to construct new research campaigns.
99.2%
Field Upload Success
An offline-first caching mechanism ensured field agents in rural areas never lost critical data during connection outages.
4.8
Play Store App Rating
Field worker app satisfaction soared from a previous 2.9 star rating due to extreme UI accessibility improvements.
“UX Pacific deep-dived into our actual field situations. They traveled with our teams, saw the physical friction points, and built a system that feels natural and extremely robust.”
Rajesh Shrinivasan
Director of Engineering, Survey Pacific
See how our strategy and design framework transforms other platforms and services.
Book a free 30-minute call.